All Articles
Checklist. How to quickly and easily create a cool infographic

Alina Temchenko
Designer at Rozdoum
5 Steps To Designing An Amazing Infographic. Learn how to make it both effective and beautiful. Here is a checklist with key steps and tips that will help you to make stunning design and turn your idea into a quality image.
Do you need simple and useful content with viral potential? Infographics may help you achieve this! But what do you do if you are not a super-skilled designer and this task only scares you? Well, need not fear because today you will learn how to visualize large amounts of data easily and without any loss of content. In order to create a masterpiece you will need a browser, some inspiration, a little imagination and of course our 5 steps that will help you create a stunning infographic: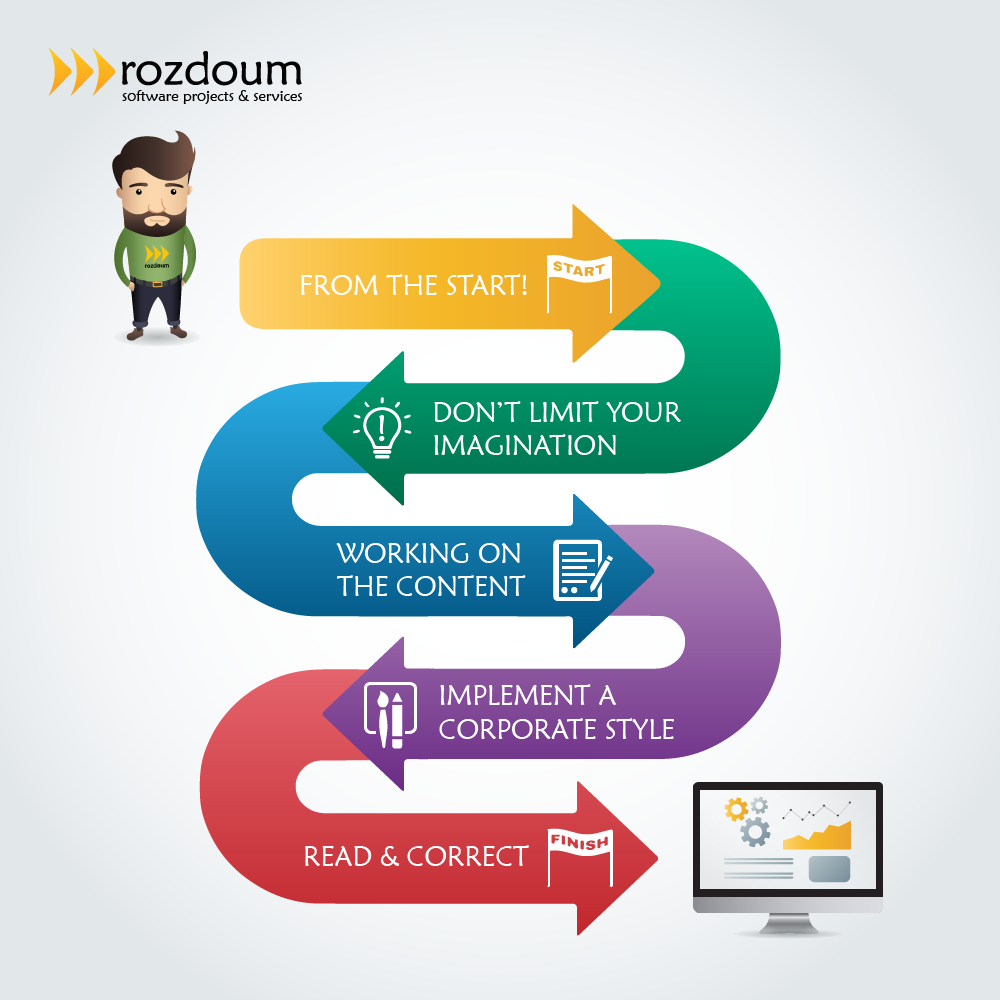
1. From the start!
Before creating infographics, it’s important to prepare for a successful start, otherwise there is a risk of running in the wrong direction, coming across unforeseen stumbling blocks and ultimately failing. Without clear answers to such questions as “Why?”, “For whom?” and “What?” infographics will not bring you the results that you are so eager to achieve.
2. Do not limit your imagination
Start by choosing a topic or content which will be the basis for the future of your infographics. If you are able to generate a huge amount of brilliant ideas but you cannot decide which to use or how to implement them, then perhaps the following tips may be helpful:
- Take into account the interests and needs of your target audience, it will definitely bring you closer to your goals.
- Pay attention to the latest trends in the market, learn Google Trends and read up on popular topics.
3. Working on the content
It is of paramount importance that the content is interesting, informative, unique and brief! Study thoroughly the structure of the material at hand. Set up your accents, devise good arguments, pick understandable symbols and notations, and highlight 3-5 key elements as well as 5-10 of the most significant figures.
4. Implement a corporate style
Choose carefully the style, fonts and color palette. If you create infographics which are directly related to the company, feel free to use corporate colors. To visualize your ideas use online tools or graphic programs. A universal method for creating a graphic doesn’t exist. Pick an online service or application that is most suitable to your needs.
5. Read and correct
Now we are within a few steps from the finish line! We only need to go over the design and content. But be careful, only one grammatical error can spoil an excellent job.
It’s cool to turn boring statistics into useful information with an attractive design!
Infographics – They are really cool, aren’t they?!
Alina Temchenko
Designer at Rozdoum

Stay on Top of the Latest IT Software Development Tips, Newest Offshore Trends, and Best Outsourcing Practices.

Technical Background
Why Your Business App Needs Offline Mode
Smartphones are now associated with the word ‘mobile’, whereas they are preferably a response to an increasingly fast-paced lifestyle. Read more …

Technical Background
Ready. Steady. Goal! How Mobile Developer Can Grow from Championship
Rozdoumites have proved the reputation of an open-minded and innovative team. Our mobile Android developer, Alexey, has joined the 12-th DEV Challenge, a Ukrainian Competition of minds, skills, and knowledge for developers. Read more …
Technical Background
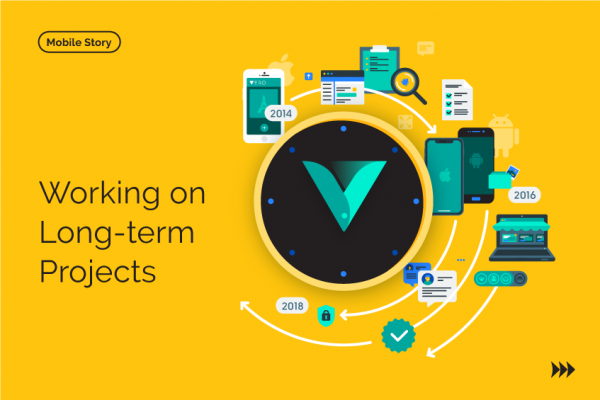
Difficulties & Discoveries of Working on Long-term Projects
For a service business, long-term projects may seem the most desirable and beneficial. Clients with a persistent strategy of development can guarantee that there will be work to do for several years. Read more …