All Articles
The importance of risk visualization when developing a software product
Atlassian team
Well, we think that it isn’t a secret to you – launching a startup is a risky business. The Internet is full of statistics that answer the question of why startups fail and what losses investors incur. And in order to save your time, we’d like to tell you that most startups fail because of mistakes made at the earliest stages. More specifically, unaccounted risks and underestimation of the challenges that startups have to overcome. And that’s where risk management steps in.

Software risk management is a set of measures aimed at predicting and minimizing all possible risks at any stage of the development process. Speaking about software development, the biggest possible risk here is to create something that nobody will use or need. The best way to deal with risk management is to decompose the entire development process into stages. That’s where the iterative software development model stands as the best option to minimize risks and clarify all the requirements for your product.
The iterative model can be described as a meaningful and stepwise decomposition of the software development life cycle. This model is usually countered with the classic waterfall model. The iterative model, in essence, is the result of the waterfall model evolution.
To understand the differences between the two models, let’s compare them. The classic waterfall model is straightforward. The product is developed stage by stage until it is fully ready. The iterative model is more about cycles and the name itself implies multiple iterations. For a better understanding, let’s recall the stages of iterative development.
Iterative software development stages
The iterative model includes 5 main stages of product development, namely:
- Planning. As in any other business, planning is the first and the most important stage. It includes selecting the necessary documentation, specifying and analyzing software or hardware requirements, and outlining subsequent phases.
- Prototyping. The second phase is fully devoted to designing product architecture. This can also include defining suitable business logic.
- Developing. The main phase where all the work is performed. That’s where all the code must be written, which will result in the first version of a functioning product.
- Testing. As elsewhere, the testing stage goes after development. As soon as your initial iteration has been planned, prototyped and developed, it’s time to check it for possible bugs and issues.
- Implementing. Also known as deployment. Once you have identified and fixed all the possible problems, it’s time to show a working product to all stakeholders. This will allow your team, future customers or sponsors to evaluate the current state of the product and possible directions where it will move in the future.
This is an iterative model as it is. Once the iteration has passed the implementation stage and all the feedback and suggestions have been analyzed, you proceed to the planning or development stage (depending on the results) and start all over again.
Here, risk management is perfectly applied because you can evaluate and avoid any pitfalls beforehand. And risk visualization will help all members of your team conduct risk assessment.
Which of the stages is the most dangerous in the context of possible risks?
Where can everything go wrong?
Of course, we’re talking about the first stage — planning. Here, the team sets the pace for the entire development process, goals and ways to achieve them. It is at the planning stage that incorrectly formulated requirements increase the risk of problems in subsequent stages.
However, how to make sure that each member of the team clearly sees and understands the requirements and risks that relate to their specific responsibilities? Risk visualization will certainly help with this. And here’s the list of useful tools.
Risk visualization tools
Speaking about risk visualization tools, one cannot ignore three products within the Atlassian ecosystem. We will talk about them below.
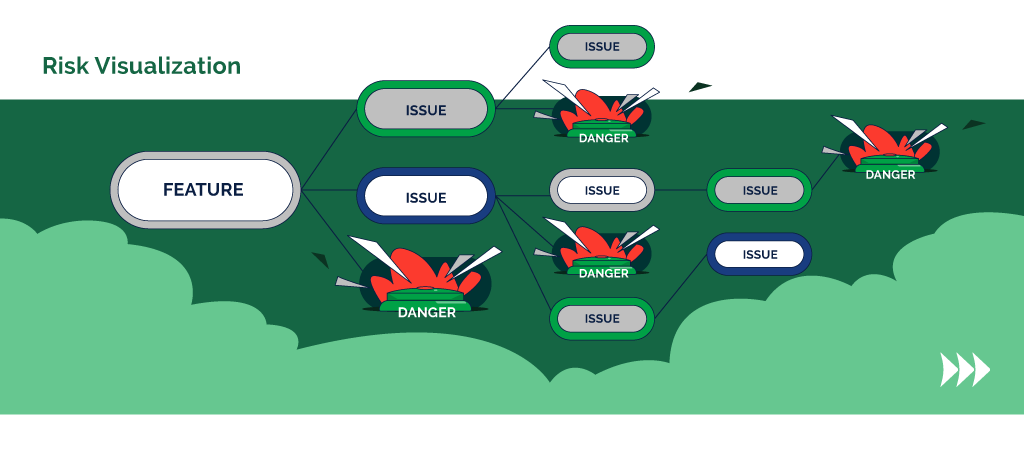
Requirements Clarity Map (RCM)
Requirements Clarity Map in an application for Confluence, which helps to visually display all the requirements for each stage of product development in the form of a tree-branch diagram. This diagram is super-easy to use and every member of your team can quickly track the changes. It literally helps you visualize the entire development scope of your product, where each stage of each new iteration will have its own understandable diagram. Such visualization allows a developer to instantly see what risks are inherent in a specific part of the work.
BigPicture
BigPicture is a versatile tool that takes product management to a new level. Using it, you can create roadmaps, portfolios for Jira Compliant, Gantt charts, implement the Project Portfolio and Resources Management options.
Regarding risk visualization, the application has a separate module for this. In this module, you can indicate the probability and consequences of risks for each individual bug, task, new feature or improvement at each stage of product development. All of these components are pulled from Jira. You can assign and update the risk status of an individual task in just two clicks in a convenient excel-like spreadsheet or in the risk matrix. Each individual task has its own assignee. So, the person responsible for it will also see information about the risks associated with this task. BigPicture also provides the possibility to adjust the risk matrix as it is convenient for you, adding the necessary values to the x-axis and y-axis.
Risk Register
Risk Register is a great risk management solution for Jira. The application allows you to conduct risk assessments for any Jira issue. Thanks to convenient sliders, you can quickly set the Impact and Probability levels of each risk.
In the Risk Register module, you can observe all risks in the form of a convenient table where you can immediately see the summary, its assignee and any other data. Here, you can also track the progress of risk treatment. In the Risk Matrix, you can overview your product’s general profile. Select one layer on the cell to understand the impact and the probability of inherent and residual risks (i.e. post-treatment ones).
It is all about convenient risk management. Using just one product, you can set treatment, assignees, change the status and state of risk, its condition, etc.
Summing up
Now, it is clear how important risk visualization is when speaking about software development. Using the iterative development model, risk management (with subsequent visualization) becomes feasible and quite useful.
After each iteration, stage by stage, each team member can visually track changes via the status of risks, and their impact. They can also define new risks that appear after treatment. Such deep understanding of risks, by all members, allows the product manager to be sure that they have managed to avoid the key issue — the risk of human error and misunderstanding.
Atlassian team

Stay on Top of the Latest IT Software Development Tips, Newest Offshore Trends, and Best Outsourcing Practices.
Integrating Platforms
Managing Projects in Multiple Jiras: Best Tools and Practices
Jira is one of the most popular project management solutions, which is specially designed for Agile software teams. Here is how you can manage projects in multiple Jiras effectively.
Project Management
How to Make Sure Uncertainty and Miscommunication Aren’t Hurting Your Project
People undercommunicate a lot and underestimate the impact assumptions and silence can have on a project. Here’s how to avoid these things and increase your efficiency by promoting clarity in your project management. Read more …
Rozdoum Products
Top Reasons to Use Jira Counters For Saving Your Time and Money
Accurate estimates are a huge part of success in project management. Read more …